Free Stock Trading Course
Lesson Six
Bullish candle formations
Candle chart combination pattern
Get ready to win the money! The most effective way to understand the shape of the stock market candles is to first divide them into three main categories:
- reverse form
- Continuation mode
- The bullish reversal form
Furthermore, it is important to remember that once we understand the rationale of candle charts, we don't want to be ourselves to using them as independent methods of stock chart analysis. The most successful price behavior prediction results combine the meaning of the candle chart with some of the other key factors affecting the price, such as support and resistance levels, especially at higher time ranges and trend lines.
Taking these factors together, we can be confident that we have a candlestick form strategy that serves us well and generates many profitable trading opportunities.
The candle chart mode is best used for daily charts because the price movements during this period contain more data to see. But that doesn't mean they can't be used for a shorter time frame, and you'll find a lot of articles or videos related to this. However, the examples and comments you will read are based on the daily candle chart. In the end, the candle chart tells a story.
Over time, individual candle maps form forms that traders can use to identify major support and resistance areas. There are many candle chart forms that can indicate the opportunities in any given market. Some candle patterns can provide insight into the balance between buying and selling pressure, while some candle patterns can identify persistent patterns or market hesitation.
So let's start out...
Six bullish candle chart pattern analysis
The bullish pattern forms at the end of the market downtrend and signals to traders that the price action is about to reverse. When you see these signals, you should consider strategies to profit from the market's upward trajectory.
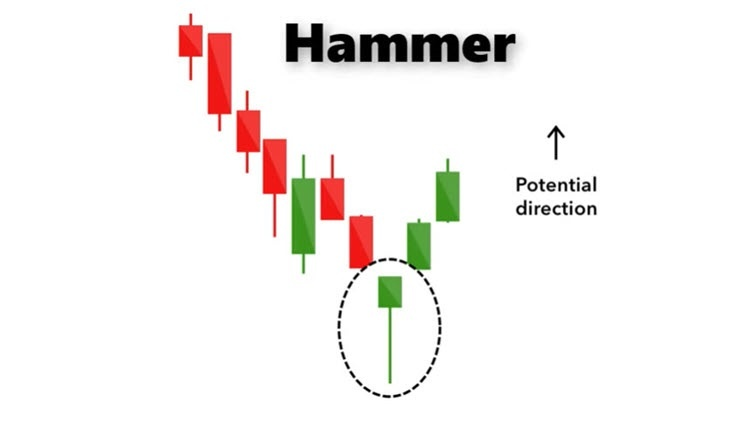
1. The hammer
The hammer candle chart pattern, consisting of short entities and long, low shadow lines, shows us that despite selling pressure on the day, it was then offset by strong buying pressure, driving prices up. The green hammer (price closing above the opening) is stronger than the red hammer (price closing below the opening).
Another name for the individual green reversal candle in the figure below is Pin Bar.
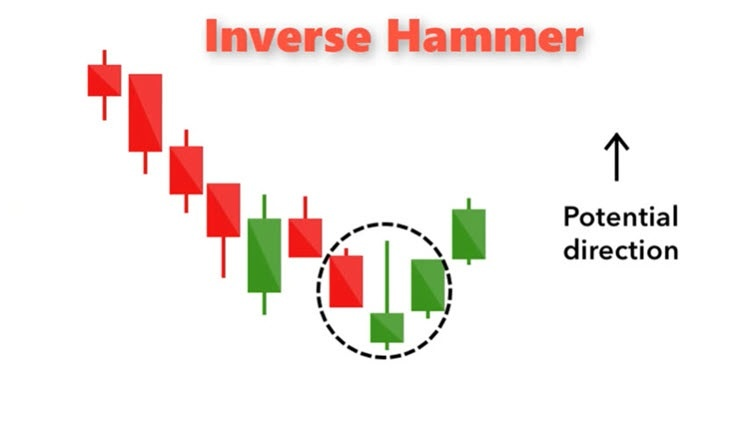
2. Inverse hammer line
The inverted hammer line is a bullish candle pattern similar to the above hammer line, and the only difference being that the upper line is longer and the lower line is shorter. It said buying pressure, followed by selling, but selling was not strong enough to drive down market prices. It tells traders that buyers may soon take control the market.
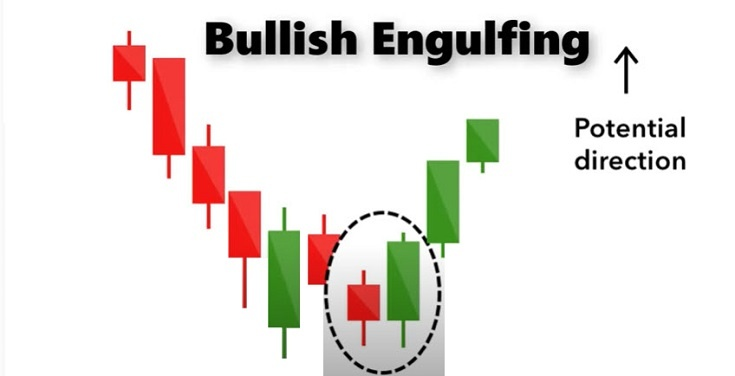
3. Bullish swallowing pattern
This is a combination of two candles. The first candle had a short red entity that was completely engulfed by a larger green candle. Although the opening price of the second day was lower than the first day, the buyer pushed up the price, and eventually the buyer won. Traders should expect that momentum to continue.
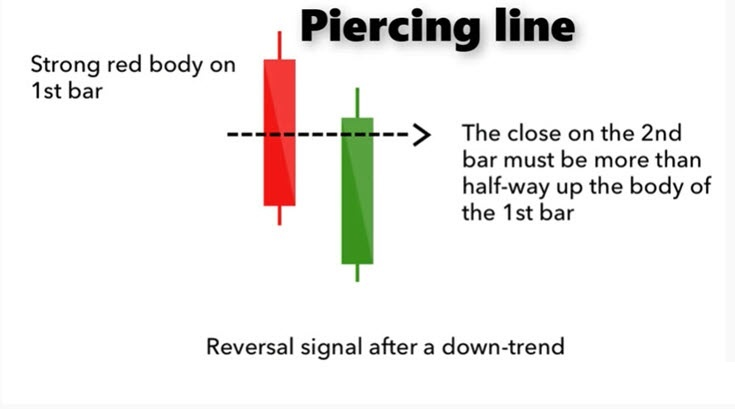
4. Piercing line
The piercing line, and the bullish eating line, is a double candlestick shape. The first candle is a long red candle (bearish). The next candle is a long green candle (bullish). It typicalso ally includes a downward jump between the closing price of the first candle and the opening price of the next candle.
It is called a "piercing thread" because the "line" is the midpoint of the first candle. To fit into piercing thread mode, the second bullish candle must push the price action to above 50% for the first candle.
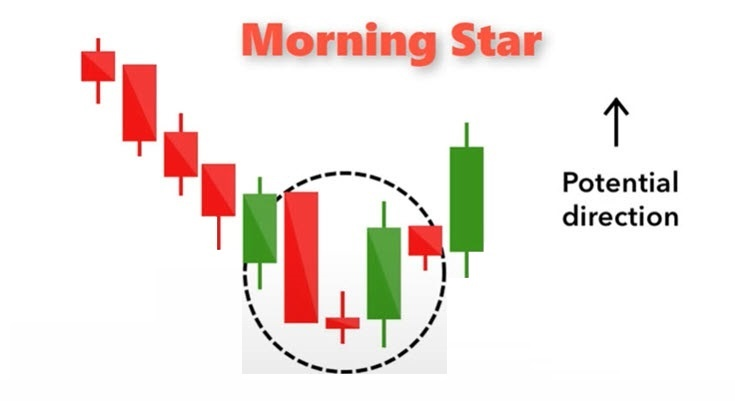
5. Morning star
With the market downtrend coming to an end, the Morningstar candle chart is seen as a sign of hope. This is a three-candle diagram. It includes a long bearish candle and a long bullish candle, on either side of a short solid candle.
To form the "morning star", the body of the small candle should not overlap with the body of the two larger candles on either side. The best morning star form occurs when the body of the third candle is higher than the first candle, but this is not important for the definition. Sometimes, a brief pause follows, and then prices continue to rise.
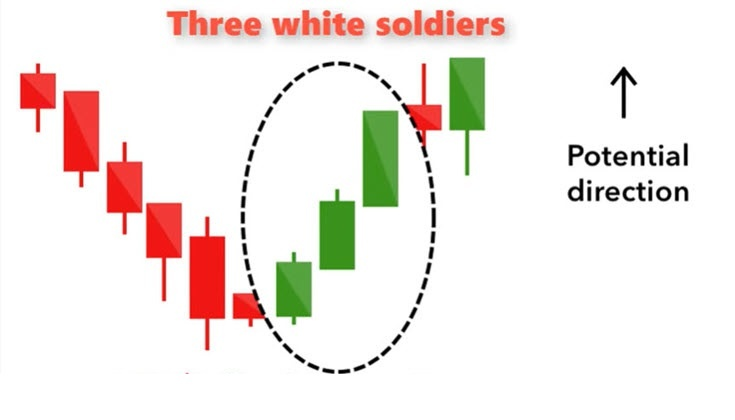
6. Three white soldiers
This pattern lasts for three days and consists of bullish green candles with small shades, each closing higher than the previous day. This is a very strong bullish signal, indicating a reversal of the downtrend.
This concludes the Bullish candle formations lesson. Please use the menu below to navigate to the lesson of your choice.
